
Several ski fields were forced to close this season due to a lack of snow, leaving many ski enthusiasts disappointed.
Hydrological forecasting scientist Dr Jono Conway said it had been an abysmal year for some areas.
“Our high elevation weather stations tell us it’s been a mixed bag for our alpine regions. Some places saw near-average snowfall but what stands out is the number of low or record low total snowfall readings,” he said.
Snow plays a significant role in both national water flows and the economy. Snowmelt contributes up to 50% of winter inflows to major hydroelectricity lakes, large areas of the South Island use meltwater for irrigation in spring and early summer, and winter tourism relies heavily on snow; in 2019, there were about 1.7 million visitors to ski fields in New Zealand.
“Mountains in the north of the South Island have been particularly bare of snow this season. The Mahanga Range site in Tasman saw less than half its average winter snowfall, as did mid- to lower-elevation sites throughout the South Island. Crawford Knob and Murchison Mountains had their lowest winter snowfall totals on record, with 1.92m and 0.46m respectively.”
“At only 0.19m deep, as recorded on 1st September, the snow at Mahanga was at a third of the average depth for that date and the second lowest on record. Mt Larkins near Queenstown and Mueller Hut above Mt Cook Village recorded moderately low snowfall with 71 and 85% of average winter totals, respectively,” said Dr Conway.
The exception was Upper Rakaia in inland mid-Canterbury, where large snowfall events during June set up the season well and regular snowfall during July and August kept total winter snowfall around the long-term average.
Other areas that recorded near average snow depths on 1st September only did so because of a large amount of snowfall in the last few days of August.
“The lack of snow was due to predominately settled, dry conditions through much of July and August. Early-season storms in the northern half of the island also brought heavy rain rather than snow. This was especially felt in Nelson-Tasman, where damaging floods devastated the region back in June and July,” said Dr Conway.
Earth Sciences NZ’s Winter and August Climate Summaries are due out this Friday, covering the season’s weather in more detail.
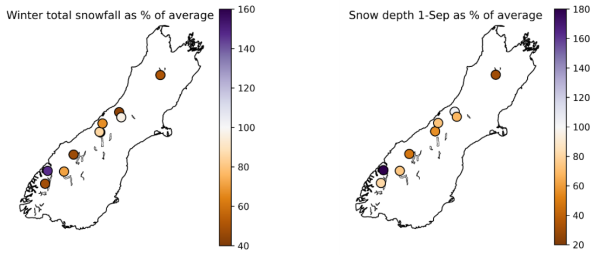
Above figures: Winter total snowfall in 2025 as % of long-term average and snow depth on 1st September as % of long-term average.
|
|
Elevation (m) |
Current winter total snowfall |
average winter snowfall |
percent of average snowfall |
min winter snowfall |
max winter snowfall |
number of years record |
|
Castle Mount EWS |
2000 |
3.50 |
2.37 |
147 |
1.52 |
5.25 |
6 |
|
Mt Cook EWS |
730 |
0.46 |
0.43 |
108 |
0.13 |
1.11 |
10 |
|
Upper Rakaia EWS |
1752 |
2.34 |
2.40 |
97 |
1.45 |
4.23 |
13 |
|
Mueller Hut EWS |
1818 |
3.37 |
3.95 |
85 |
2.58 |
5.32 |
10 |
|
Mt Larkins EWS |
1900 |
2.22 |
3.10 |
71 |
1.84 |
5.53 |
12 |
|
Crawford Knob EWS |
1612 |
1.92 |
2.87 |
67 |
2.34 |
3.16 |
3 |
|
Mahanga EWS |
1940 |
0.76 |
1.48 |
51 |
0.70 |
3.14 |
13 |
|
Murchison Mtns EWS |
1140 |
0.46 |
0.96 |
48 |
0.48 |
2.70 |
16 |
|
Albert Burn EWS |
1280 |
0.76 |
1.62 |
47 |
0.74 |
2.77 |
14 |
|
Ivory Glacier CWS |
1390 |
0.80 |
1.82 |
44 |
0.66 |
3.32 |
8 |
Table 1. Winter snowfall (metres) compared to long-term average (ordered by % of average). Site without representative data for 2025 or the historical period are not shown.
|
|
elevation |
current snow depth (m) |
average snow depth (m) |
% of average snow depth |
current SWE (m w.e.) |
average SWE |
% of average SWE |
|
Castle Mount EWS |
2000 |
0.76 |
0.29 |
259 |
|
|
|
|
Ivory Glacier CWS |
1390 |
0.30 |
0.29 |
103 |
|
|
|
|
Murchison Mtns EWS |
1140 |
0.11 |
0.13 |
81 |
0.03 |
0.05 |
61 |
|
Mt Larkins EWS |
1900 |
0.47 |
0.64 |
74 |
0.21 |
0.24 |
89 |
|
Crawford Knob EWS |
1612 |
1.35 |
1.84 |
73 |
|
|
|
|
Upper Rakaia EWS |
1752 |
0.38 |
0.55 |
68 |
|
|
|
|
Mueller Hut EWS |
1818 |
0.99 |
1.75 |
56 |
0.42 |
0.71 |
58 |
|
Albert Burn EWS |
1280 |
0.13 |
0.27 |
48 |
|
|
|
|
Mahanga EWS |
1940 |
0.19 |
0.65 |
30 |
|
|
|
Table 2. Snow depth (metres) and snow water equivalent (SWE; metres w.e.) on 1 September 2025 compared to long-term average (ordered by % of average)